This page gathers data measured in real-world use (actual trips!): appliance consumption, daily usage, and — as we collect it — solar and alternator yield. With accurate, real-world data, you can make better predictions about sizing your own electrical system. So we hope that helps.
This is a living page. FarOutVan #2 is fully instrumented (more on that below) and we add results as they come in — we are currently at home working on the van, so more data will come later during summer 2026. Last data added: July 2026.
Our Vans
FarOutVan #1
DIY Electrical System
Battery: 2,500 Wh (200Ah @ 12V)
Solar: 320 W
Alternator Charger: 700 W
Shore Charger: 360 W
Inverter: 1,000 W
Stovetop, Oven, Hot Water: Propane

FarOutVan #2
EcoFlow Power Kit System
Battery: 10,000 Wh (800Ah @ 12V)
Solar: 700 W
Alternator Charger: 1,200 W
Shore Charger: 1,800 W
Inverter: 4,000 W
Stovetop, Oven, Hot Water: Electric

Appliance Consumption
Our current van runs an EcoFlow Power Kit with an all-electric galley: induction cooking, electric oven, electric water heater, and two e-bikes charging in the garage. Full specs, wiring, and breaker sizes live in the install guide’s complete loads list; this page is about what those loads actually consume. We track the loads that move the needle — every light, fan, and USB outlet is in the loads list, but they won’t make or break your battery bank.
All Appliances Overview
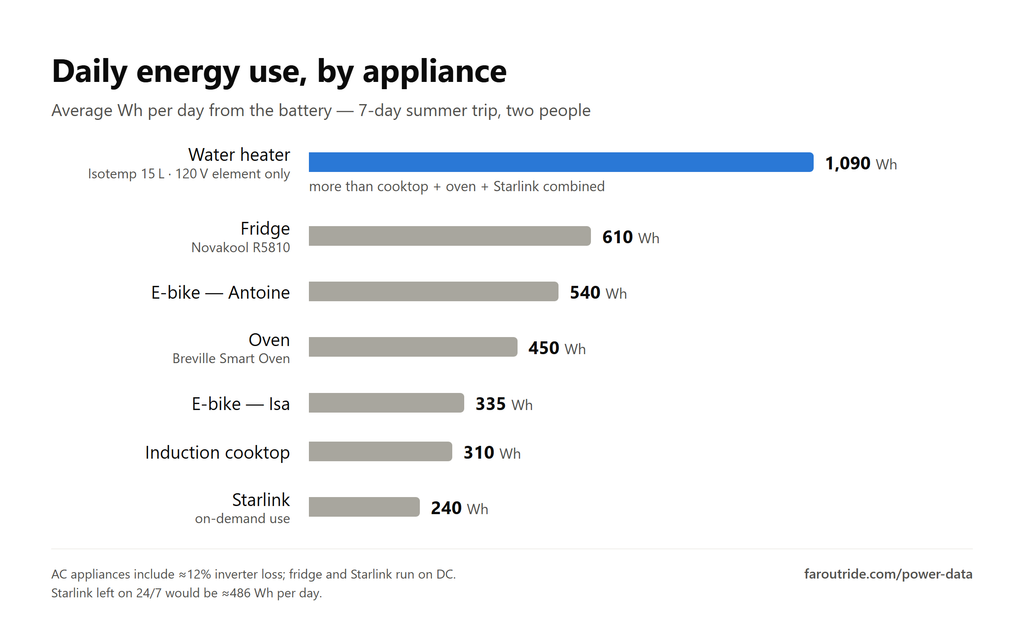
Here’s the daily energy use, by appliance, before connecting the Isotemp Water Heater to the engine coolant loop. That graph is what convinced us to go on with the engine coolant project…
Induction Cooktop
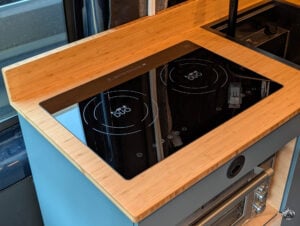
The True Induction Mini Duo Cooktop lives on the Sink, Induction, and Oven Cabinet:
Cooking Pasta + Heating Sauce
One element comes on at ~946 W (pasta water), the sauce element joins at ~4.5 min (~1400 W combined), a brief 1633 W peak when both ran high, then turned down to a ~750 W simmer around 15 min, off at ~21 min. Total: 369 Wh at the plug, ≈414 Wh from the battery with the 12% inverter loss. A full pasta dinner costs about a third of a water-tank heat-up — nice data point.
A Week of Real-World Cooking
Same 7-day trip. The cooktop’s morning duty is boiling water for the manual espresso machine — 3-4 shots between the two of us — then a session for lunch or dinner most days; we also ate out a few evenings, so this is a normal mix, not every meal on board. Daily totals stayed small: 125-422 Wh at the plug, averaging ≈275 Wh per day, 1.9 kWh for the week. With the 12% inverter loss, that’s ≈310 Wh per day from the battery — a full day of induction cooking costs less than the pasta dinner above.
More meals coming…
Oven
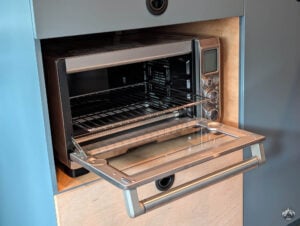
The Breville Smart Oven Pro lives in the Sink, Induction, and Oven Cabinet:
Making Toast
The oven comes on at ~1846 W and holds a flat ~1815 W for the whole run — no element cycling on the toast setting — then off at ~4 min. Total: 127 Wh at the plug, ≈142 Wh from the battery with the 12% inverter loss. Sunday-morning toast costs about a third of the pasta dinner.
A Week of Real-World Reheating
On the road, our oven turned out to be mostly a reheater: stuffed peppers one night (≈410 Wh), fish another (≈375 Wh), a pizza warm-up, toast some mornings — and one day it stayed off entirely, where the 12 Wh is just its standby clock. Daily totals: 12-921 Wh at the plug, averaging ≈400 Wh per day, 2.8 kWh for the week. With the 12% inverter loss, that’s ≈450 Wh per day from the battery. Cooktop and oven together: ≈680 Wh per day at the plug — ≈760 Wh from the battery for a fully electric galley.
Water Heater
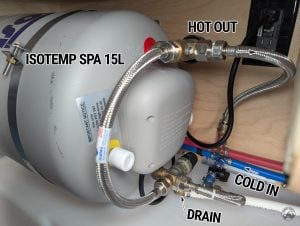
The Isotemp SPA 15L lives in the Water Cabinet. It features a 750W element and can also be connected to the vehicle’s coolant system for “free” hot water (done! full guide here):
Full Tank Heat-Up
Heating a full 15 L tank from room temperature — the “we just filled up, let’s make it shower-ready” scenario — is one steady pull: 726 W average for 1 h 21 min. Total: 980 Wh at the plug, ≈1100 Wh from the battery with the 12% inverter loss. In practice we do the initial heat-up on shore power before leaving the house, so the battery only pays for top-ups on the road.
Maintaining Temperature (no hot water use)
With nobody using hot water, the Isotemp fires a short reheat burst — ≈800 W for 3-4 min — about every 55 minutes: every ~45 min at night, with longer gaps during the warm afternoon. That adds up to ≈1386 Wh per day at the plug. Keeping the tank hot costs ≈1552 Wh per day from the battery with the 12% inverter loss — more than heating the tank from cold once. Worth switching the heater off when you won’t need hot water for a while.
A Week of Real-World Use
During a 7-day trip in August (two of us), we heated the tank on a simple routine — one session in the morning, one in the evening, ≈850 W while the element runs — rather than keeping it hot all day. That gave us just enough hot water for dishes, plus showers on some days. Days without showers came in at 602-690 Wh at the plug; shower days ran 1035-1472 Wh. Average: ≈975 Wh per day, 6.8 kWh for the week. With the 12% inverter loss, that’s ≈1090 Wh per day from the battery — about 30% less than the ≈1552 Wh of keeping the tank on hot standby around the clock, with actual hot water use included this time.
Risks of a warm tank
One thing to know before copying this routine: a tank that spends the day warm-but-not-hot sits right in the 20-45°C band where Legionella multiplies (the exposure risk is inhaled shower mist, not drinking). The fix is built into the heater: the Isotemp’s thermostat is factory-set at 75°C, and our heat-up data confirms the tank actually gets there (980 Wh into 15 L ≈ a 56°C rise) — hot enough to kill Legionella almost instantly (even 60°C takes only minutes). So every few days, and after the van has been sitting unused, let a session run to the cutoff instead of stopping at shower-warm: a couple hundred extra watt-hours buys a pasteurized tank. We drain the heater when the van sits between trips, which covers the storage side.
Legionella has two warm-water cousins: Pseudomonas aeruginosa (skin rashes and ear infections — a contact risk, not an inhaled one) and nontuberculous mycobacteria (slow-growing lung pathogens, mainly a concern for immunocompromised people). All three like the same conditions — warm stagnant water, faded chlorine, biofilm — and the same habits control them: run the tank to the cutoff every few days, keep the water moving, drain when parked. For perspective: documented cases from small marine heaters are rare; outbreaks trace to cooling towers, hot tubs, and large building systems.
Sources: HSE — managing legionella in water systems · temperature vs. Legionella survival · Isotemp SPA 15 spec (75°C thermostat) · opportunistic pathogens in water systems — review
e-Bikes
Full Charge (0-100%)
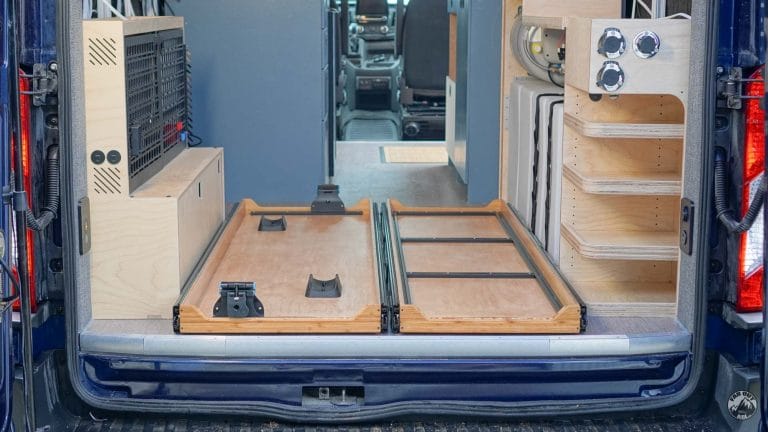
Two mountain bikes charge from the van: Isa’s Santa Cruz Bullit (600 Wh battery, Bosch BPC3410 fast charger) and Antoine’s Forbidden Dreadnought-E (800 Wh battery, DJI Avinox standard and fast chargers), which replaced his Transition Repeater (630 Wh battery, Shimano EC-E8004 fast charger) in September 2026. Here is a full 0-100% charge for each, measured at the plug. The Dreadnought-E’s curves are typical curves built from one measured charge on each charger, with the fast charger’s thermal throttling smoothed out:
Two takeaways. First, plan for roughly 650-700 Wh per full charge of a 600-630 Wh battery — a bit more than the battery’s rating, because the charger keeps 5-10% as losses (call it ~0.75 kWh from the van battery, with inverter overhead). The 800 Wh Dreadnought-E scales with its battery: about 885 Wh at the plug for a full charge (≈1 kWh from the van battery) and about 5 h 10 on the standard charger, or ≈920 Wh and about 2 h 30 on the fast charger, which loses a little more in the charger. Second, the chargers get there differently: the Bosch and the DJI standard charger both climb steadily to a 188 W peak, but the Bosch then tapers down to 20 W over 40 minutes, while the DJI ramps down for about 20 minutes and shuts off abruptly at ~102 W; the DJI fast charger climbs from ~380 to ~455 W, holds ~320 W for a dozen minutes, then ramps down over half an hour to the same ~100 W cut (in our measured charge it also dropped to ~300 W for a few minutes twice while the warm battery throttled it, which the chart smooths out); the Shimano held a flat ~152 W for almost four hours, then tapered and shut itself off at 30 W. Charging both bikes from empty is now ≈1.5-1.6 kWh at the plug, about one and a half water-tank heat-ups. In practice, the daily top-ups below are what a normal week costs.
A Week of Real-World Charging
Full-charge curves are the worst case — here’s what a week of actual riding looks like. During the same 7-day trip (August 2026, Antoine still on the Repeater), we rode nearly every day and topped the batteries up after the ride, in the afternoon or evening. The top-ups came out well under a full charge: Antoine’s bike averaged ≈480 Wh per day at the plug (297-652 Wh), Isa’s ≈300 Wh (0-451 Wh, with one rest day). Both bikes together: ≈780 Wh per day, 5.4 kWh for the week. With the 12% inverter loss, that’s ≈870 Wh per day from the battery for two daily riders — about one full charge’s worth per day, split across two bikes, and a bit less than the water heater’s day.
Fridge
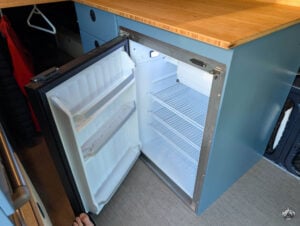
The Novakool R5810 Fridge (5.8 cu.ft.) lives in the Fridge Cabinet:
One Summer Day
Over one summer day — cabin swinging from 16 °C at dawn to 34 °C mid-afternoon — the NovaKool R5810 averaged 21.7 W, its 51 W compressor running ≈43% of the time. The duty follows the cabin temperature: more rest overnight, longer runs through the warm evening. Total: 522 Wh per day, measured on the DC side — no inverter in the loop. A winter day will be cheaper; we will log one when we get there.
A Week of Real-World Cooling
A full week on the road backs up the one-day measurement — and stretches it. Daily totals ran 418-694 Wh on the DC side, averaging ≈610 Wh per day (≈25 W around the clock), 4.3 kWh for the week. The spread is partly the cabin heat — on the sun-parked afternoon that hit 33°C inside, the compressor ran flat-out at ≈46 W for nine hours — and partly us hunting for the right thermostat setting: the first days held the food at a too-cold 1-2°C, we overshot to ~10°C mid-week (the 418 Wh day), then settled around 5-6°C. The fridge is the one load you never switch off — but at ≈610 Wh per day it still eats less than hot water for two.
Roof Fan
Power Draw vs Speed
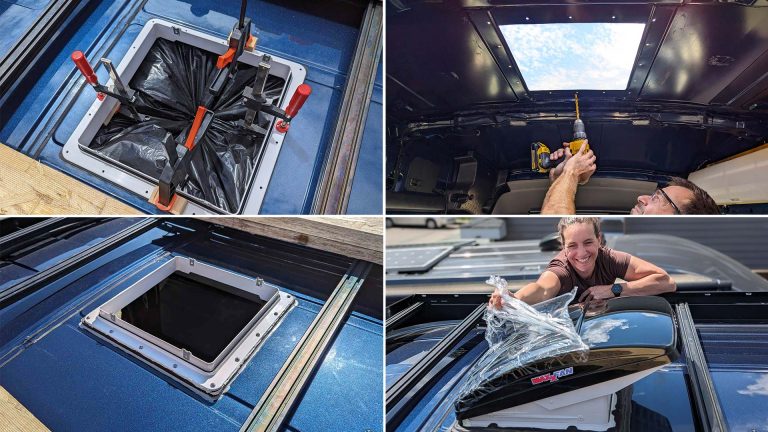
We stepped our Maxxfan Deluxe from speed 10 down to 0, holding each speed for ~15 seconds, and read the power at each plateau. Speed 10 pulls ≈45 W, speed 5 only ≈17 W, speed 1 barely 2 W (DC side, no inverter). The top speeds cost the most — going from 5 to 10 nearly triples the draw for the last bit of airflow.
Power Draw vs Intake Restriction
Also tested: windows (the intake) fully closed vs fully open — no change in power draw, but a very noticeable change in airflow (that one we can’t measure).
Is that expected? Yes — even if intuition says otherwise. The intuition trap is thinking of the fan like a pump fighting a blocked pipe, “straining” against the restriction and drawing more current. But there is no feedback loop in a Maxxfan: the motor gets a fixed PWM duty for the speed you set, and its power draw is just RPM × torque. The torque comes from accelerating air mass through the blades — choke the intake and the blade actually has less air to push (the van goes slightly under-pressure and the fan mostly churns), so the aerodynamic load stays the same or drops a touch. For propeller-style axial fans, power is typically highest at free flow and flat-to-slightly-lower when restricted — the opposite of a centrifugal pump. Add that our readings are integer watts on a ~45 W load, and a few-percent dip would be invisible.
The consequence: watts don’t measure ventilation. With the windows closed the fan draws the same 45 W while delivering close to zero fresh-air exchange — the energy cost per unit of actual ventilation goes through the roof. Opening an intake is “free airflow” from the battery’s point of view.
A Week of Real-World Ventilation
What does ventilation cost over a real week? Almost nothing. The fan ran most afternoons and evenings at low speeds — 5-9 W as an hourly average — pushed to ~14 W on the warmest evenings, and spent the nights at speed 1 or off — at 1-2 W, a full night of sleeping airflow costs ~15 Wh, a rounding error. Daily totals: 35-132 Wh, averaging ≈74 Wh per day, ≈515 Wh for the whole week, straight from the 12V side with no inverter loss. That’s about half of one day of hot water. The temperature trace tells the honest story too: a fan is not air conditioning — parked in the sun, the inside climbed to 33°C against 26°C outside — but on the hottest afternoon of the trip (36°C outside), moving air and shade kept the inside around 30°C.
Starlink Mini
One Day, Left On 24/7
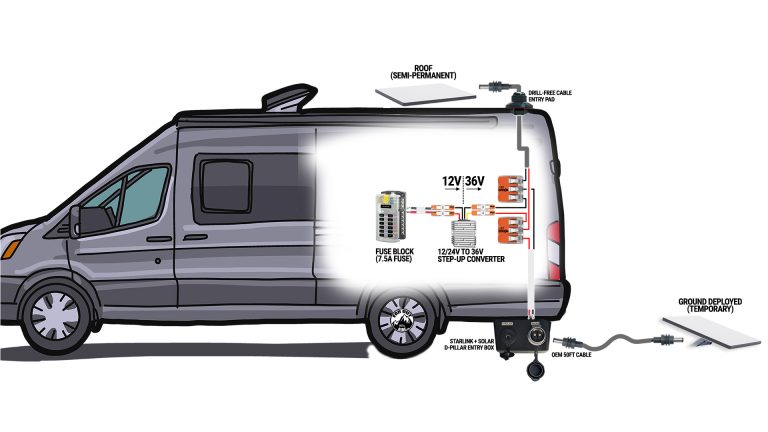
Left on 24/7, the Starlink Mini idles at a steady 18-20 W with a bump to ≈39 W during heavy evening use. Total: 486 Wh per day (DC side, no inverter) — about as much as the fridge. Switching the dish off overnight would save ≈150 Wh/day.
A Week of On-Demand Internet
The measurement above is the dish left on 24/7 (486 Wh); here’s what our actual habit costs. We power the dish on demand — 4 to 15 hours on most days — and it drew a steady ≈18 W whenever on. Daily totals: 83-269 Wh, except the day we forgot it on overnight: ~23 hours, 447 Wh, neatly confirming the 24/7 figure. Average: ≈240 Wh per day, 1.7 kWh for the week — on-demand use cut the dish’s cost in half.
Wi-Fi Router
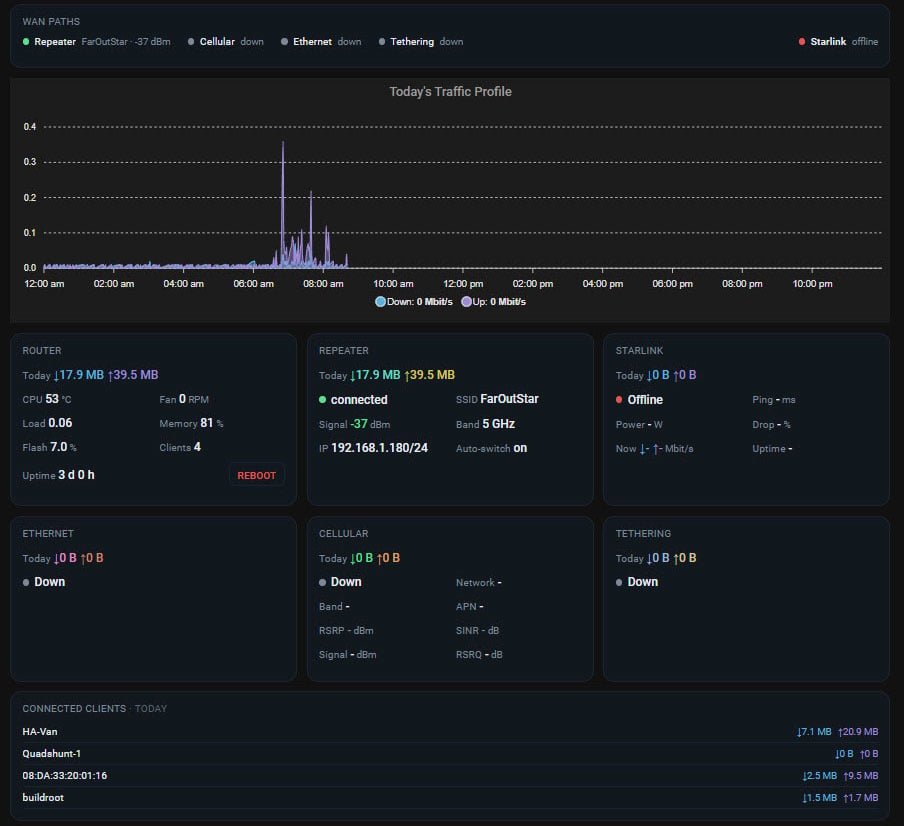
The router (GL.iNet X3000) is the van’s network hub, and it has three ways to reach the internet: its built-in 5G modem (SIM card), Starlink as its upstream, or repeater mode, where it grabs an outside Wi-Fi network (campground, cafe, home) and rebroadcasts it inside the van. Whatever the source, every device in the van stays on the same van Wi-Fi — switching sources never touches a device.
That flexibility is also a power strategy. The router runs 24/7 anyway, and both 5G and repeater mode ride on its small budget — while Starlink adds its own ≈500 Wh/day on top when left on around the clock. So the pecking order is: repeater when there is Wi-Fi to borrow, 5G where there is coverage, and Starlink only where nothing else works. We have not isolated the router’s own power consumption yet — coming soon.
Daily Power Usage
Coming soon!
Solar Yield

Coming soon!
Alternator Charge
Coming soon!
FarOutVan #1
Our first van (our home from 2017 to 2021) ran a classic 12V build: lithium batteries, Victron solar charging, and a Sterling B2B alternator charger (later upgraded to a Victron Orion XS 50A Charger). We had less instrumentation back then, so this section is short — but the data aged well.
Measured Summer Daily Power Usage
The Victron SmartSolar charge controller can’t measure loads directly, but it measures harvest. So when (1) no other charge source is used and (2) there is more solar available than we need, harvest = usage. Here is a month of summer days measured that way:

Summer vs Winter Solar Harvest
We couldn’t measure winter usage (the Sterling B2B did most of the charging, unmetered), but we could still compare solar harvest across seasons:

No surprise: winter harvest is way, way lower than summer — and the summer numbers are actually understated, since harvest stops once the battery is full. This is why we were glad to have the Sterling B2B: Plan B in summer, Plan A in winter. Solar + alternator remains, in our opinion, the balanced combo for a van electrical system.
How We Measure
AC Appliances
AC appliance consumption is measured at the plug (120V side). But what really matters is how much energy is drawn from the battery bank, so we add about 12% loss to account for inverter losses.
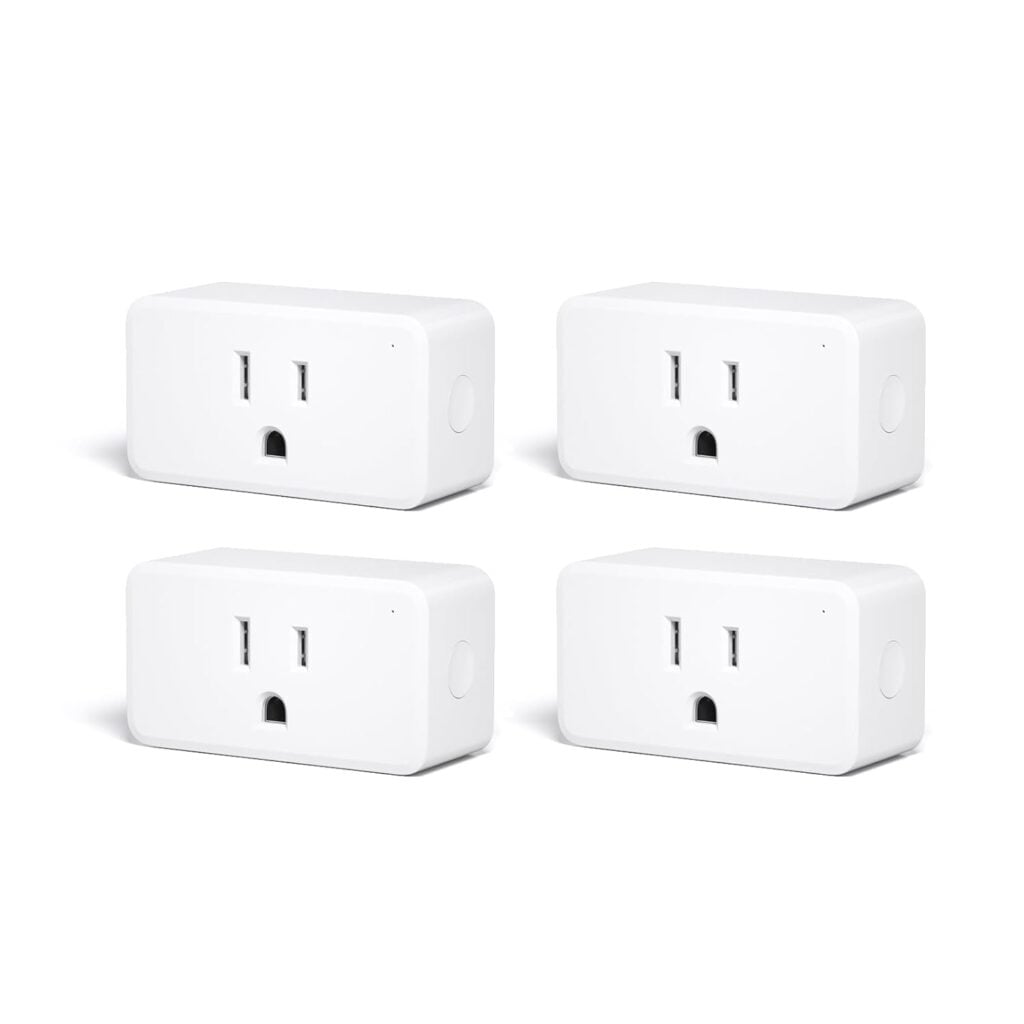
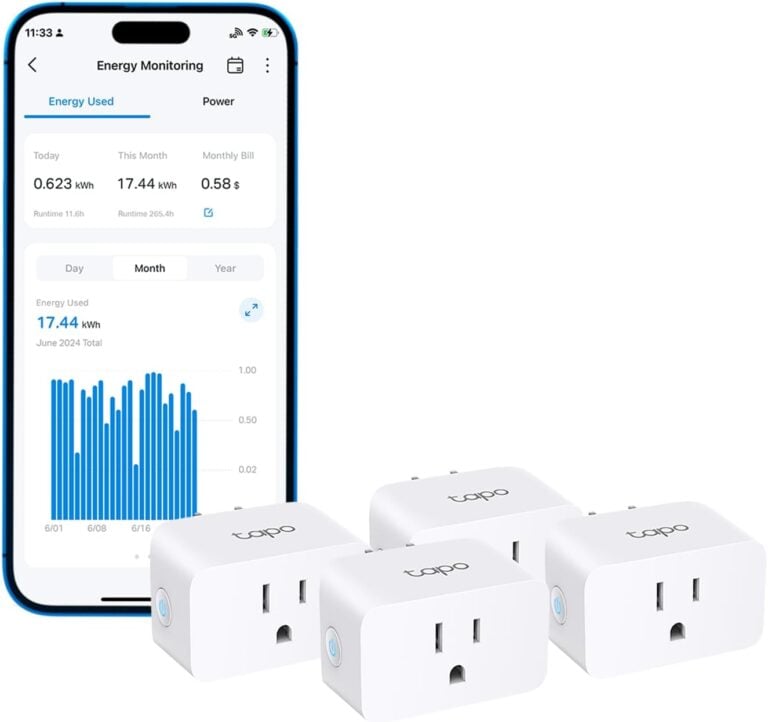
That’s the easy part. We use Smart Plugs with built-in Energy Monitoring.
We chose Zigbee Smart Plugs, because plugs using this protocol draw very little power themselves. If you don’t have a fancy Home Assistant system in your van, you can simply use Wi-Fi Smart Plugs (no hub needed), but be aware that these plugs draw more power themselves.
DC Loads
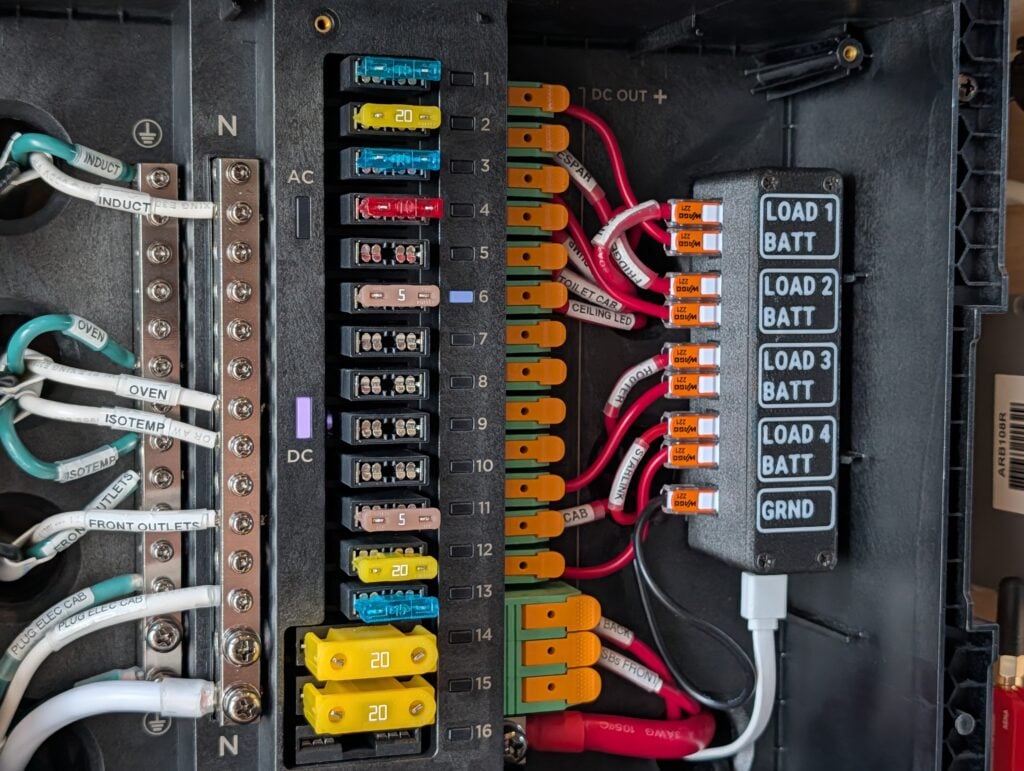
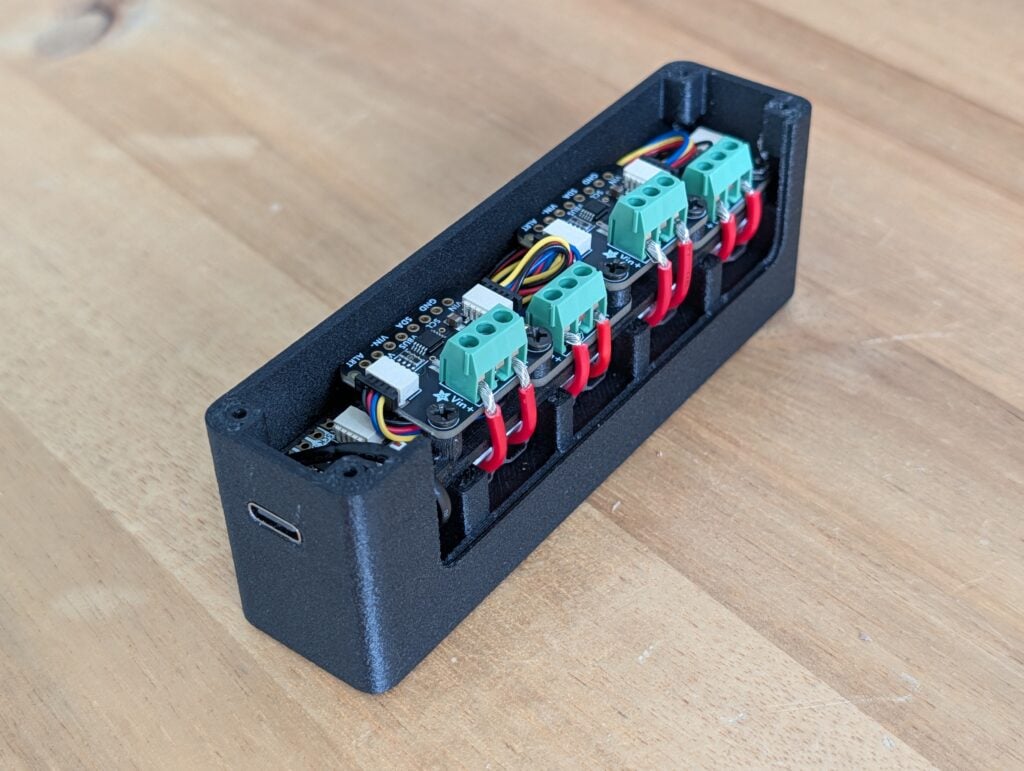
Here, we had to get a bit geeky and build our own power-monitoring device (a.k.a. the “Quad-Shunt”). It lives in the EcoFlow Distribution Panel, and we can measure 4 devices simultaneously (space constraints).
The Quad-Shunt lives in the EcoFlow Power Kit’s Distribution Panel:
It’s made of 1 x ESP32 board (it’s like a mini-computer that can transmit data over Wi-Fi), 4 x INA228 Energy-Monitoring Boards, and Wago Connectors:
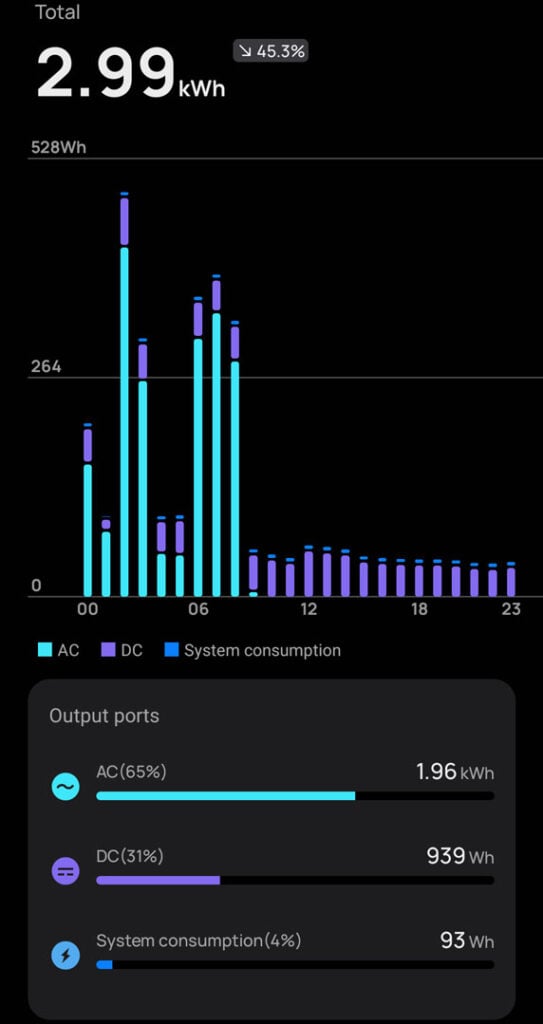
System Level
(Solar, Alternator, Daily Usage)
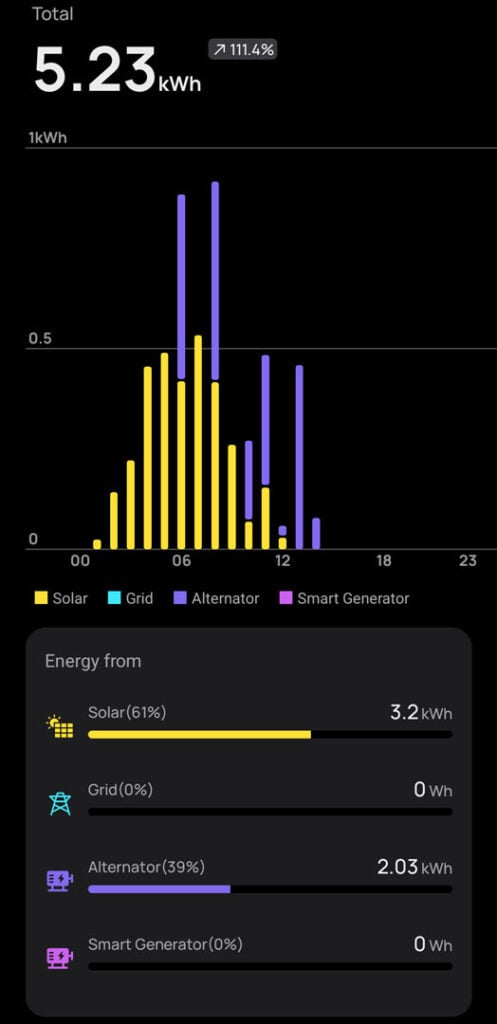
Data will be taken from the EcoFlow App:
Home Assistant
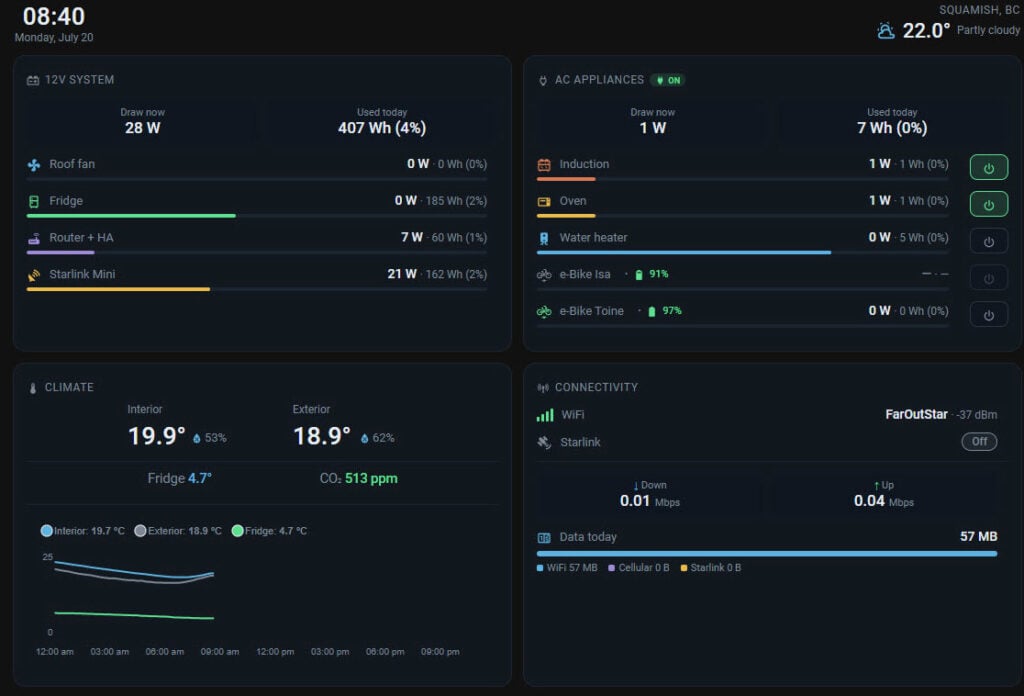
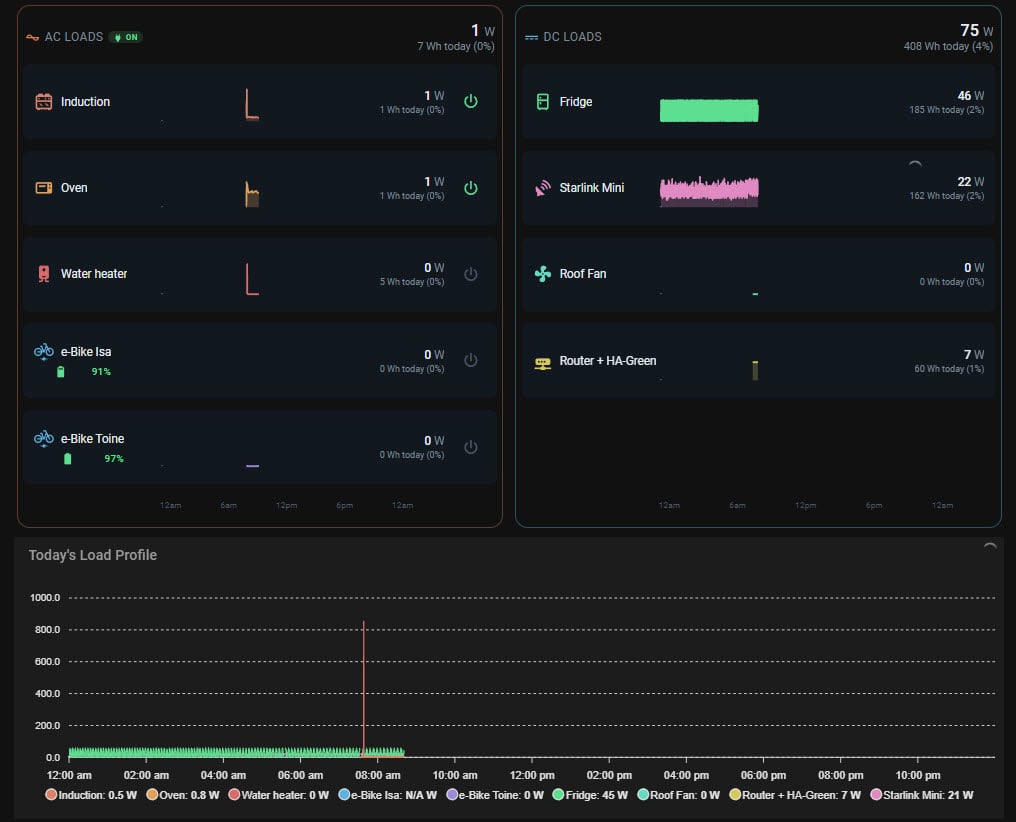
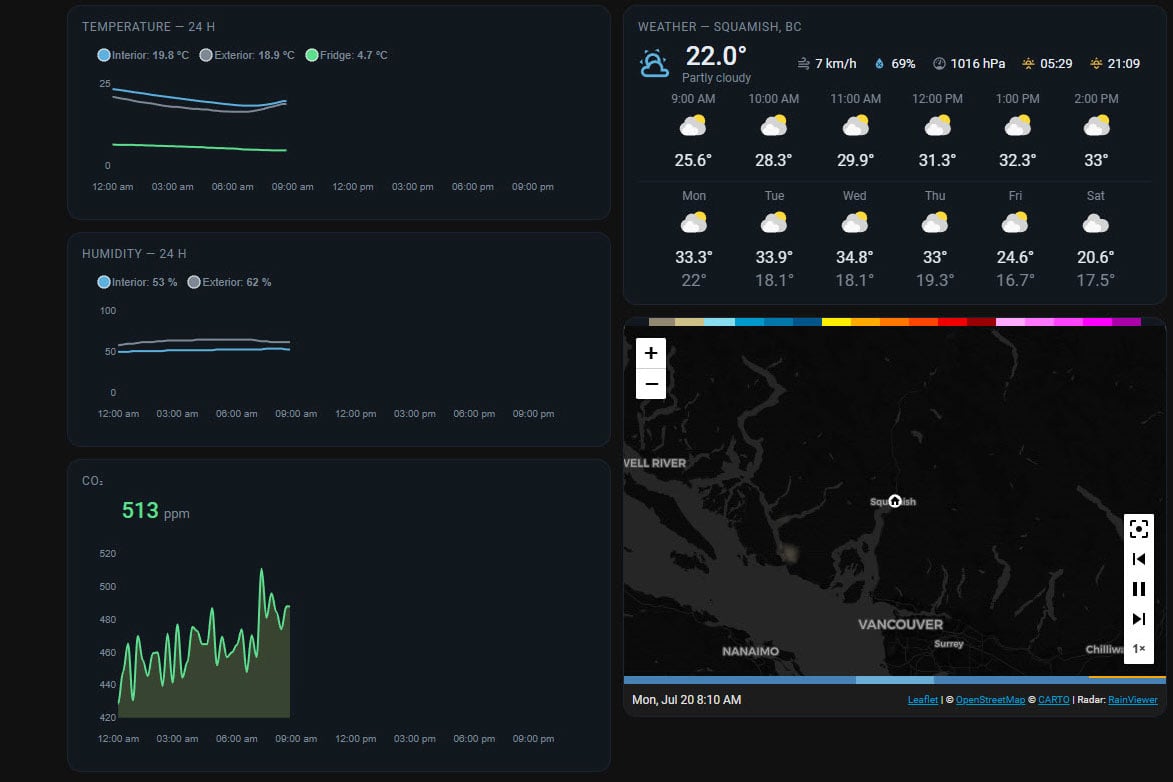
All the data is gathered by a Home Assistant Green; it’s like a mini-computer built specifically to run Home Assistant. We made a custom dashboard (still in progress) to track the important stuff in FarOutVan #2:
Overview Panel:
Power Panel:
Climate Panel:
Connectivity Panel: